STATISTICS

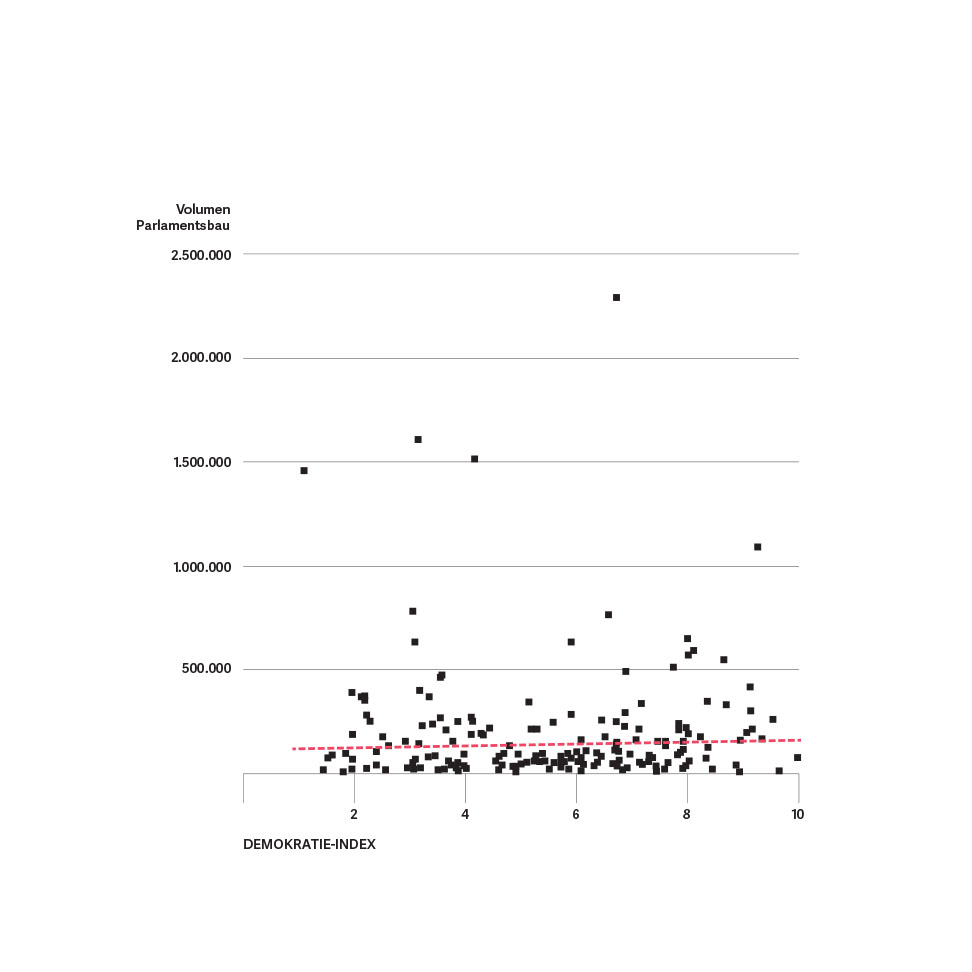
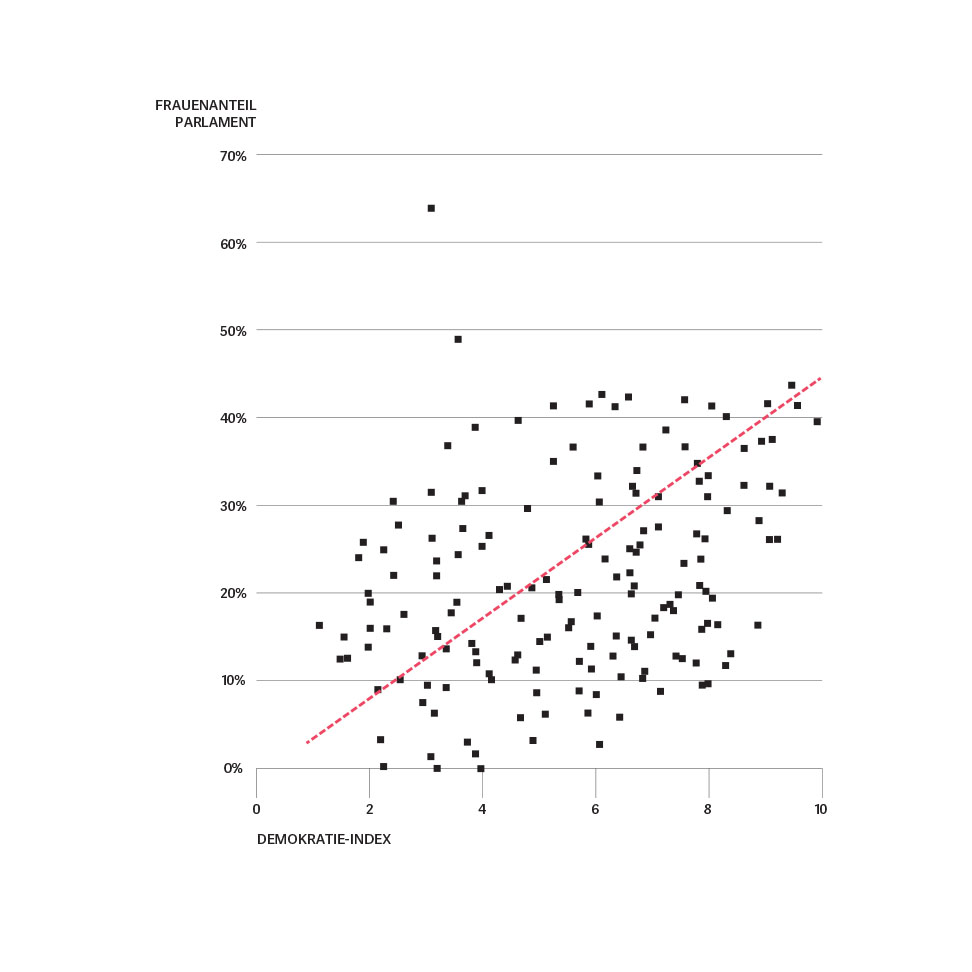
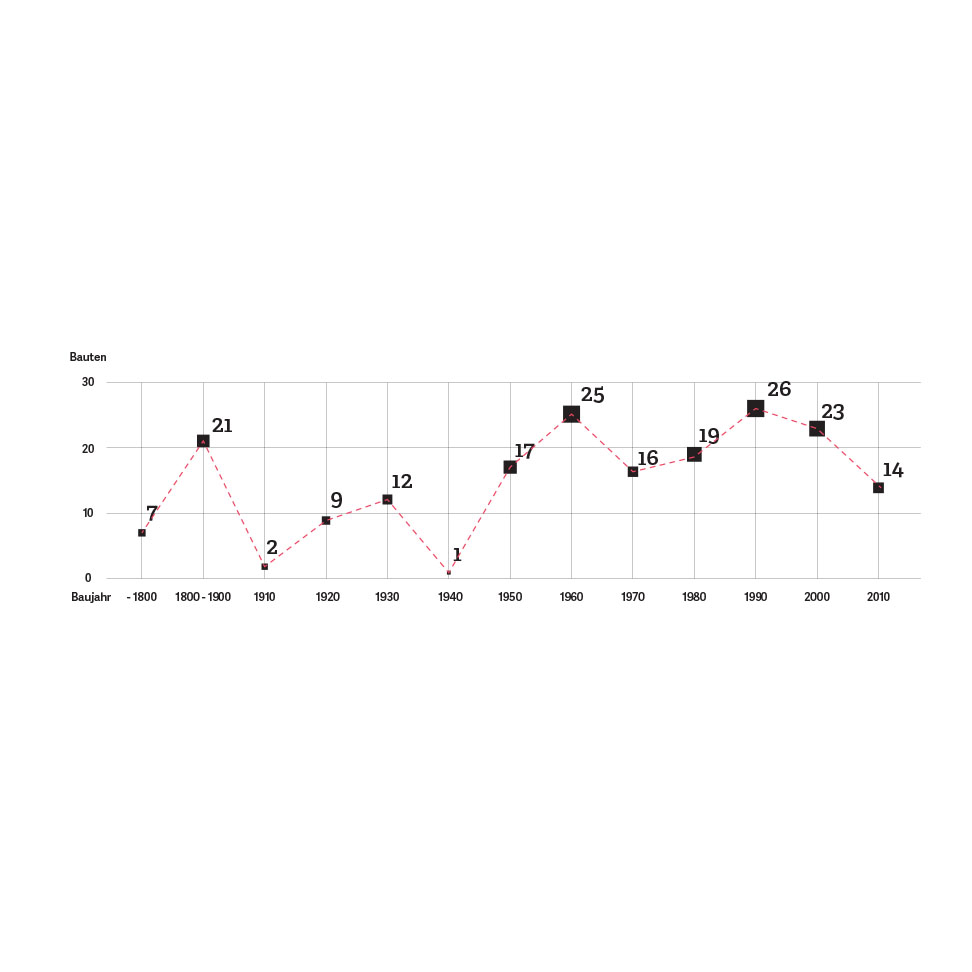
Considering parliamentary buildings of authoritarian regimes such as the Parliament in Bucharest, which was to become the largest administrative building in the world, one could conclude that a low democracy index is an indication of the size of parliamentary buildings. Trying to relate the size of the parliament and the volume of the building with the democracy index of the respective country, however, no clear correlation can be found. This may also be due to the fact that comparatively small countries with authoritarian regimes, especially in Africa, are in the lower third of the democracy index ratings. It should be noted that the four largest parliament buildings are in North Korea, Myanmar, China and Romania. On the other hand, the graph comparing all the parliaments studied in terms of the proportion of women in parliament and the democracy index, shows a tendency that is not surprising. The more women are represented in a parliament, the higher the democracy index was found. Historical events such as the end of World War II or the collapse of the USSR can be read in the time graph showing the years of construction of the parliaments. 


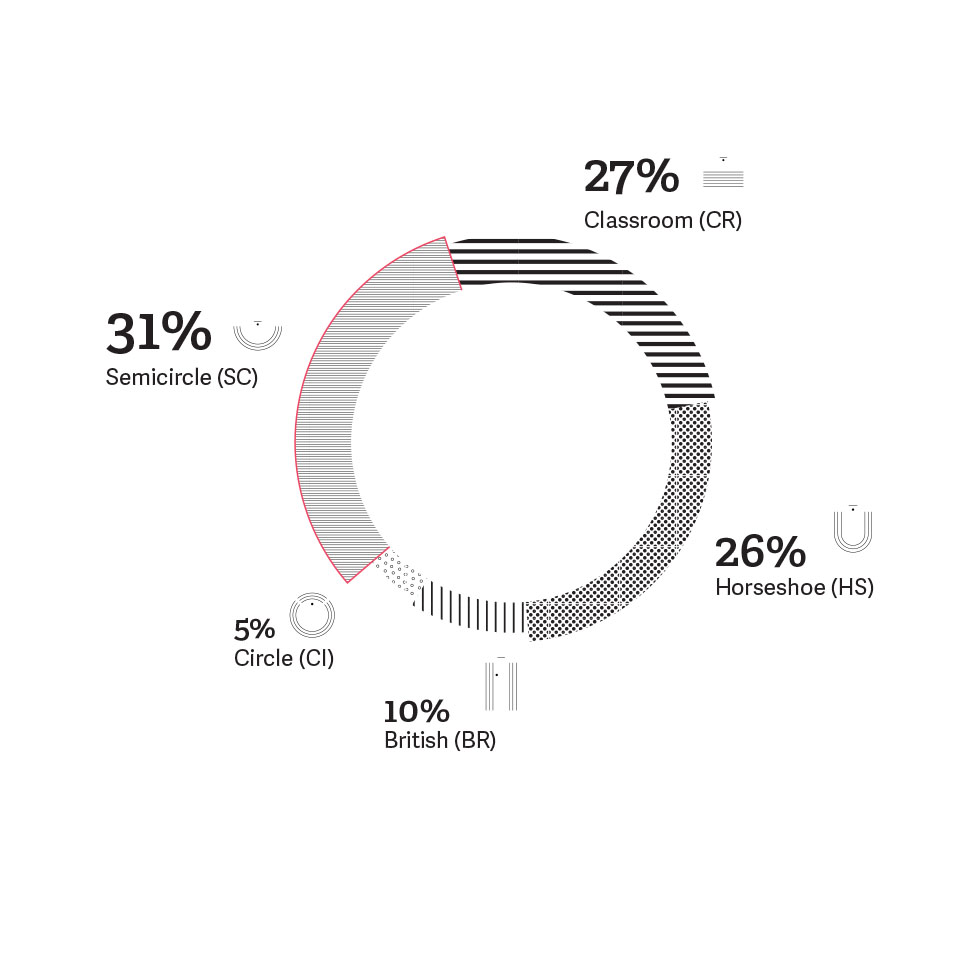
The analysis of the collected data shows that the French type is the most common type of plenary halls in comparison to all national parliament buildings of the 193 UN member states. 

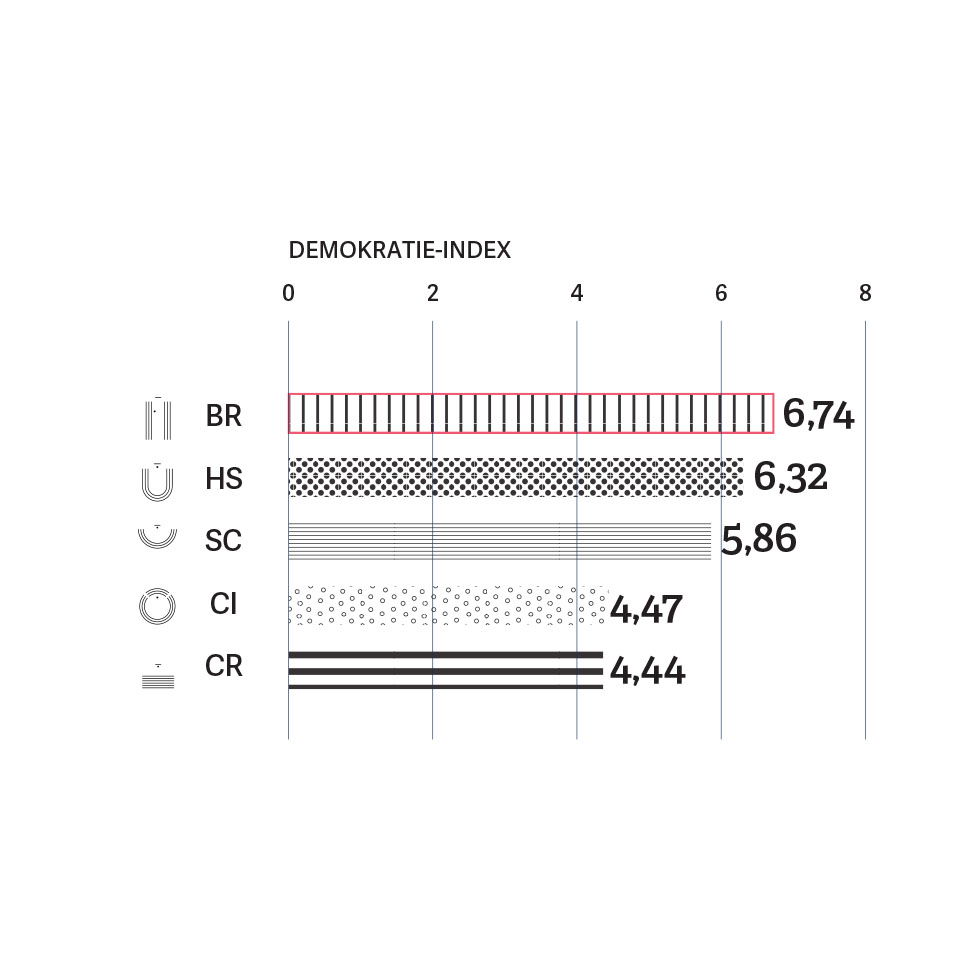
If the Democracy Index, established by the magazine, “The Economist,” is put into context with the layout of the plenary hall, it becomes clear that the classroom type is used in the least democratic countries. The type showing the highest average of democracy index is the British type with opposite rows of benches. The circular type scores comparatively poorly. However, this hall layout is represented only ten times in the compared parliament buildings. Among them, Jordan, Sudan and Uzbekistan with below-average low democracy indexes.


CountryPop.BuiltType ofVolumeMPWomen inPop. perCO2 EmissionsGDPHDI HumanDI
(dec)Plenary HallParliamentlegislator(ons per capita)($ per Capita)Development IndexDemocracy Index
Afghanistan29.824.536-CR179.00024927,7%119.7770,31.5310,372,48
Albania3.162.0831950CR12.50014020,0%22.5861,49.4030,755,67
Algeria39.666.5191950SC91.20046231,6%85.8583,514.1930,743,95
Andorra78.3601580SC15.7002850,0%2.7996,637.2000,85-
Angola20.820.525-SC237.90022036,8%94.6381,66.0060,513,35
Antigua and Barbuda89.0691980BR15.5001910,5%4.6875,919.6400,76-
Argentinia41.086.9271900SC218.00025736,6%159.8714,518.2000,816,84
Armenia2.969.0811950SC260.20013110,7%22.6641,48.4170,734,09
Australia22.683.6001980HS1.092.70015026,0%151.22416,944.5980,949,22
Austria8.462.4461880SC549.80018332,2%46.2428,043.6610,898,62
Azerbaijan9.297.5072000CR397.50012215,6%76.2095,110.1250,733,15
Bahamas388.0191810BR7.3003813,2%10.21111,123.4910,79-
Bahrain1.317.8271970SC15.5004010,0%32.94519,324.5910,802,53
Bangladesh154.695.3681980HS630.4002976,4%520.8590,41.8510,515,86
Barbados283.2211870BR205.0003016,7%9.4405,426.4880,82-
Belarus9.495.8261930SC212.10011027,3%86.3267,318.1850,803,62
Belgium11.142.1571780SC60.50015041,3%74.2811039.7520,908,05
Belize359.2871970BR7.600323,1%11.2281,47.9370,70-
Benin10.050.7022000CR104.100838,4%121.0920,51.5570,446,00
Bhutan774.8301950HS92.600478,5%16.4861,97.8160,614,93
Bolivia10.496.2851920CR72.00013025,4%80.7401,55.1960,685,84
Bosnia and Herzogovina3.833.9161980CR205.0004221,4%91.2838,19.3930,745,11
Botswana2.262.4851960CR21.900629,5%35.9122,816.0990,707,87
Brazil198.656.0191960CR326.7005138,6%387.4232,211.7160,737,12
Brunei412.2382000HS196.500330,0%12.49222,952.4820,86-
Bulgaria7.304.6321880CR40.80024024,6%30.4355,916.0440,786,72
Burkina Faso16.460.1411960SC11.50012718,9%129.6070,11.4880,343,52
Burundi9.849.5691980CR24.20010530,5%93.8050,035510,353,60
Cambodia15.577.8992000CR188.70013220,3%126.6500,33.2630,564,27
Cameroon23.344.1791960HS56.90018031,1%129.6900,42.9720,513,66
Candada35.939.9271920BR417.80033826,0%106.33115,944.0570,919,08
Cap Verde520.5021980CR88.3007220,8%7.2290,26.5200,657,81
Central African Republic4.900.2741960CR86.00010512,4%46.6690,25940,351,57
Chad14.037.4722010CR77.90018814,9%74.6670,12.1820,391,50
Chile17.948.1411990SC221.60012015,8%149.5684,422.3460,837,84
China1.376.048.9431950CR1.611.0002.95923,6%465.0397,613.2060,733,14
Colombia48.228.7041920SC121.70016619,9%290.5341,513.3570,726,62
Comoros788.4141970CR41.400333,0%23.8930,21.4290,503,71
Congo4.620.3301980CR155.6001367,4%33.9731,16.2770,592,91
Costa Rica4.807.8501950HS56.7005733,3%84.3481,514.9180,777,96
Côte d’Ivoire22.701.5561960HS78.9002519,2%90.4440,43.2580,463,31
Croatia4.240.3171910SC80.70015115,2%28.0824,821.2100,826,93
Cuba11.389.5621920CR467.50061248,9%18.6102,710.2000,773,52
Cyprus1.165.3002000HS31.5005612,5%20.8096,330.8730,857,53
Czech Republic10.543.1861720SC50.50020020,0%52.71610,430.4070,877,94
Democratic Republic of Congo77.266.8141970CR374.7004928,9%157.0460,17460,432,11
Denmark5.669.0811920HS300.00017937,4%31.6717,144.9160,929,11
Djibouti887.8612010CR27.0005512,7%16.1431,63.2700,472,90
Dominica72.6801990BR3.6003221,9%2.2712,310.8770,72-
Dominican Republic10.528.3911950CR152.90018320,8%57.5322,213.2620,716,67
East Timor1.184.7652000SC59.7006538,5%18.2270,32.2270,607,24
Ecuador16.144.3631950SC93.20013741,6%117.8412,711.3720,735,87
Egypt91.508.0841920HS26.90059614,9%153.5372,710.5300,693,18
El Salvador6.126.5831970SC138.1008432,1%72.9361,18.3510,676,64
Equatorial Guinea845.0601960SC4.50010024,0%8.4512,734.7390,591,77
Eritrea5.227.7911990-34.70015022,0%37.8520,11.2000,392,37
Estonia1.312.5581850CR114.50010123,8%12.99615,126.9460,867,85
Ethiopia99.390.7501930CR6.20054738,8%181.7020,11.5000,443,83
Federated States of Micronesia104.4601980CI24.700140,0%7.4611,23.3310,64-
Fiji892.1451990HS27.6005016,0%17.8431,58.7920,735,49
Finland5.503.4571930SC195.60020041,5%27.51710,139.9810,889,03
France64.395.3451720SC160.10057726,2%111.604538.8470,897,92
Gabon1.725.2921990SC152.40012014,2%14.3772,919.4300,683,76
Gambia1.990.9242010HS34.100539,4%37.5650,11.7000,442,97
Georgia3.999.8122010SC273.60015011,3%26.6651,57.5820,755,88
Germany80.688.5451990SC334.10063136,5%127.8749,345.8020,928,64
Ghana27.409.8931960HS28.00027510,9%99.6720,54.0820,586,86
Greece10.954.6171840SC153.90030019,7%36.5156,425.8770,877,45
Grenada106.8251700BR4.8001533,3%7.1224,512.4250,75-
Guatemala16.342.8971930HS11.80015813,9%103.4360,87.4540,635,92
Guinea12.608.5901960SC143.10011421,9%110.6020,21.2210,413,14
Guinea Bissau1.844.3252000CR18.50010213,7%18.0820,21.3860,421,93
Guyana767.0851830HS17.9006930,4%11.1173,47.2000,646,05
Haiti10.711.067-CR35.200920,0%116.4250,21.7320,483,94
Honduras8.075.0601950CR22.90012825,8%63.08614.9090,615,84
Hungary9.855.0231900HS492.20019810,1%49.7734,424.7210,836,84
Iceland329.4252000HS11.4006341,3%5.22911,643.3040,909,58
India1.311.050.5271920HS513.60054312,0%2.414.4581,85.7010,617,74
Indonesia257.563.8151960CR168.80055517,1%464.0791,810.5170,687,03
Iran79.109.2822000SC369.4002903,1%272.7917,917.3030,772,16
Iraq36.423.3951980SC189.10032826,5%111.047415.0570,654,08
Ireland4.688.4651740HS41.70016616,3%28.2447,448.7550,928,85
Israel8.064.0361960HS209.50012026,7%67.2008,333.2300,897,77
Italy59.797.6851690HS205.40063031,0%94.9175,534.7060,877,98
Jamaica2.793.3351960BR7.2006312,7%44.33938.8750,727,39
Japan126.573.4811930SC644.8004759,5%266.47010,136.4260,897,96
Jordan7.594.5471990CI47.00015012,0%50.630312.0500,753,86
Kazakhastan17.625.2262000HS636.00010726,2%164.72214,224.2280,793,06
Kenya46.050.3021960HS57.10035019,7%131.5720,32.9540,555,33
Kiribati112.4232000HS13.900466,5%2.4440,41.8090,59-
Korea50.293.4391970SC561.30030016,3%167.64512,334.3560,907,97
Kosovo1.823.1491960CR47.60012033,3%15.1931,69.114/-
Kuwait3.892.1151990SC253.300651,5%59.87928,373.2460,823,85
Kyrgystan5.939.9621970CR94.80012019,2%49.5001,33.3220,655,33
Laos6.802.0231990CR23.20013225,0%51.5300,55.3210,572,21
Latvia1.970.5031860HS38.60010018,0%19.7053,722.8730,827,37
Lebanon5.850.7431930SC26.4001283,1%45.7094,217.4620,774,86
Lesotho2.135.0222010CI48.90012025,0%17.7920,22.6380,506,59
Liberia4.503.4381950CR45.7007311,0%61.6910,28410,434,95
Libya6.278.4382010HS252.20018816,0%33.3968,115.5970,722,25
Liechtenstein37.5312000CI14.7002520,0%1.5011,489.4000,91-
Lithuania2.878.4052000SC128.30014123,4%20.4144,126.7420,847,54
Luxembourg567.1101860HS8.5006028,3%9.45219,397.6620,898,88
Macedonia2.078.4531930CR76.60012333,3%16.8984,513.1420,756,02
Madagascar24.235.3901960CR20.40015120,5%160.4990,11.4390,514,85
Malawi17.215.2322000HS244.40019216,7%89.6630,18220,445,55
Malaysia30.331.0071960HS175.20022210,4%136.6267,525.6390,786,43
Maldives363.6572010CR27.000855,9%4.2782,812.5300,71-
Mali17.599.6941960CR42.9001478,8%119.7260,11.5990,425,70
Malta418.6702010BR20.8007012,9%5.9815,634.7000,848,39
Marshall Islands52.9931990SC37.000339,1%1.60623.803/-
Mauritania4.067.5641960CR26.50014725,2%27.6710,63.9120,513,96
Mauritius1.273.2121970HS69.2006911,6%18.4522,618.5850,788,28
Mexico127.017.2241980SC763.50049842,4%255.0553,717.1080,766,55
Moldavia4.068.8971970SC72.60010121,8%40.2862,24.9830,696,35
Monaco37.7312010SC20.4002420,8%1.57278.700--
Mongolia2.959.1342000HS252.4007614,5%38.9365,111.9460,736,62
Montenegro625.7811950SC16.6008117,3%7.7264,114.3380,806,01
Morocco34.377.5111930SC43.60039517,0%87.0321,87.4910,634,66
Mozambique27.977.8631990HS16.50025039,6%111.9110,21.1290,424,60
Myanmar53.897.1542010CR1.516.1004339,9%124.4740,21.6000,544,14
Namibia2.458.8301910BR60.10010441,3%23.6431,59.9560,636,31
Nauru10.2221990HS200195,3%5380,114.800/-
Nepal28.513.7001990CR134.70059929,5%47.6020,22.3740,554,77
Netherlands16.924.9291990SC160.70015037,3%112.8339,447.6630,928,92
New Zealand4.528.5261980HS170.50012131,4%37.4267,536.3900,919,26
Nicaragua6.082.0322000SC215.3009241,3%66.1090,84.9180,635,26
Niger19.899.1201950CR18.90011313,3%176.0980,19380,353,85
Nigeria182.201.9622000SC90.6003605,6%506.1170,55.9110,514,62
North Korea25.155.3171980CR1.452.30068716,3%36.6162,41.800/1,08
Norway5.210.9671860HS78.50016939,6%30.8348,764.8560,949,93
Oman4.490.5412010BR779.900841,2%52.83018,938.6310,793,04
Pakistan188.924.8741980CR220.00034020,6%555.6610,94.8110,544,40
Palau21.2912000HS76.900160,0%1.3311,614.7570,78-
Palestine4.668.4661970SC8.40013212,9%35.3670,54.5090,684,57
Panama3.929.1412010SC61.5007118,3%55.3402,620.8950,787,19
Papua New Guina7.619.3211980HS169.2001112,7%68.6430,92.8550,506,03
Paraguay6.639.1232000SC106.2008015,0%82.9890,88.9110,686,33
Peru31.376.6701930HS47.50013022,3%241.3591,711.9890,736,58
Philippines100.699.3951970CR289.90029027,2%347.23916.9690,676,84
Poland38.611.7941950HS212.90046027,4%83.9397,824.7440,847,09
Portugal10.349.8031990HS235.90023034,8%44.9994,529.3930,837,79
Qatar2.235.3551980CR233.900350,0%63.86739,1140.6490,853,18
Romania19.511.3241990CR2.293.60040113,7%48.6573,619.4010,796,68
Russia143.456.9181930CR373.50040513,6%318.79312,425.6360,803,31
Rwanda11.609.6661960CR68.6008063,8%145.1210,11.6610,483,07
Saint Kitts and Nevis55.5721980BR10.5001513,3%3.7053,223.2390,75-
Saint Lucia184.9991980CI9.4001816,7%10.278310.7330,73-
Saint Vincent and the Grenadines109.4621980SC4.4002313,0%4.7592,810.7270,72-
Samoa193.2281970CI10.000496,1%3.9430,75.7890,70-
San Marino31.7811890CR16.5006016,7%53062.000/-
São Tomé and Príncipe 190.3441970CR77.1005518,2%3.4610,33.1760,56-
Saudi Arabia31.540.3721990SC391.30015119,9%208.87716,851.9240,841,93
Senegal15.129.2731950SC55.40015042,7%100.8620,62.3330,476,08
Serbia8.850.9751930SC106.50025034,0%35.4045,912.6600,776,71
Seychelles96.4711990BR15.3003243,8%3.0155,826.3860,77-
Sierra Leone6.453.1841960SC71.62012112,4%53.3320,21.9660,414,55
Singapore5.603.7401990BR115.4009223,9%60.9108,782.7630,916,14
Slovakia5.426.2581990SC87.50015018,7%36.1756,427.7110,847,29
Slovenia2.067.5261950CI48.7009036,7%22.973829.9630,887,57
Solomon Islands583.5911990CI28.000502,0%11.6720,52.1300,51-
Somalia10.787.1042010CR49.00027513,8%39.2260,1400--
South Africa54.490.4061920HS151.70040042,0%136.2267,413.0460,677,56
South Sudan12.339.8122000SC48.30033226,5%37.1682.0190,47-
Spain46.121.6991990HS130.90035040,0%131.7765,133.2110,888,30
Sri Lanka20.715.0101980BR255.8002255,8%92.0670,810.7330,766,42
Sudan40.234.8821960CI108.40042630,5%94.4480,44.0690,482,37
Suriname542.9751950BR11.8005125,5%10.647416.6380,716,77
Swasiland1.286.9701990HS18.400656,2%19.8000,58.2920,533,09
Sweden9.779.4261900SC256.80034943,6%28.0214,645.1830,919,45
Switzerland8.298.6631900SC199.30020032,0%41.4934,957.2350,939,09
Syria18.502.4131950HS21.30025012,4%74.0102,45.1000,591,43
Taiwan23.415.1261960CR96.00011332,7%207.21411,847.500/7,83
Tajikistan8.481.8551940CR72.0006319,0%134.6330,42.6910,621,95
Tanzania53.470.4202000HS55.20037236,6%143.7380,22.5380,525,58
Thailand67.959.3591970CR57.1001976,1%344.971415.7350,735,09
Togo7.304.5781970CR81.3009117,6%80.2700,31.4290,483,41
Tonga106.1701990HS500260,0%4.0831,95.2110,72-
Trinidad and Tobago1.360.0881900BR47.6004231,0%32.38325,331.9670,777,10
Tunisia11.253.5541900HS62.30021731,3%51.8602,211.4360,726,72
Turkey78.665.8301960SC343.10055014,9%143.0294,719.1990,765,12
Turkmenistan5.373.5022000CR98.90012425,8%43.33513,315.4740,691,83
Tuvalu9.9162000HS23.300156,7%6610,13.765--
Uganda39.032.3831960BR75.90038635,0%101.1200,11.7710,485,22
Ukraine44.823.7651930SC77.90042212,1%106.2175,58.6650,755,70
United Arab Emirates9.205.6511970SC137.5004017,5%230.14119,941.3970,822,58
United Kingdom64.715.8101870BR350.00065029,4%99.5636,539.7620,918,31
United States of America321.773.6311830SC590.80043419,4%741.41416,554.6290,928,05
Urugay3.431.5551920SC180.0009916,2%34.6622,420.8840,798,17
Uzbekistan29.893.4881990CI188.00015016,0%199.2904,25.5730,681,95
Vanuatu264.6521990HS30.600520,0%5.0890,43.0310,59-
Venezuela31.108.0831870SC45.10016714,4%186.2766,316.1000,765,00
Vietnam93.447.6012010CR263.30049824,3%187.6462,15.6290,673,53
Yemen26.832.215-SC280.3003010,0%89.4410,92.8000,502,24
Zambia16.211.7671960HS40.60015812,7%102.6060,23.9040,596,28
Zimbabwe15.602.7511890HS55.80027031,5%57.7880,91.7920,513,05